Controlling Accounts
De Controlling-applicatie biedt diepgaande inzichten in je financiële gegevens en geeft je de flexibiliteit om de evolutie van je klanten- en leveranciersrelaties grondig te begrijpen via zeer gedetailleerde analyses. Deze specialisatie leidt rechtstreeks tot beter onderbouwde beslissingen en een meer strategische bedrijfsplanning. Voor onmiddellijke bruikbaarheid worden instellingen zoals periodiciteit of multi-currency automatisch overgenomen uit je Finance-applicatie, met een primaire focus op domeinen zoals Klanten/Leveranciers, Resultatenrekeningen (P&L), …
Klant en leveranciersdiepgang
Krijg diepgaande, data-gedreven inzichten in de prestaties van je klanten en leveranciers. Onze geavanceerde visualisaties bieden een strategisch overzicht van de geografische spreiding van je klanten, samen met de bijbehorende kosten- en omzetdynamiek in belangrijke regio’s. Dit geeft je cruciale inzichten in potentiële groeiregio’s en marktsaturatie.
Strategic P&L and market command
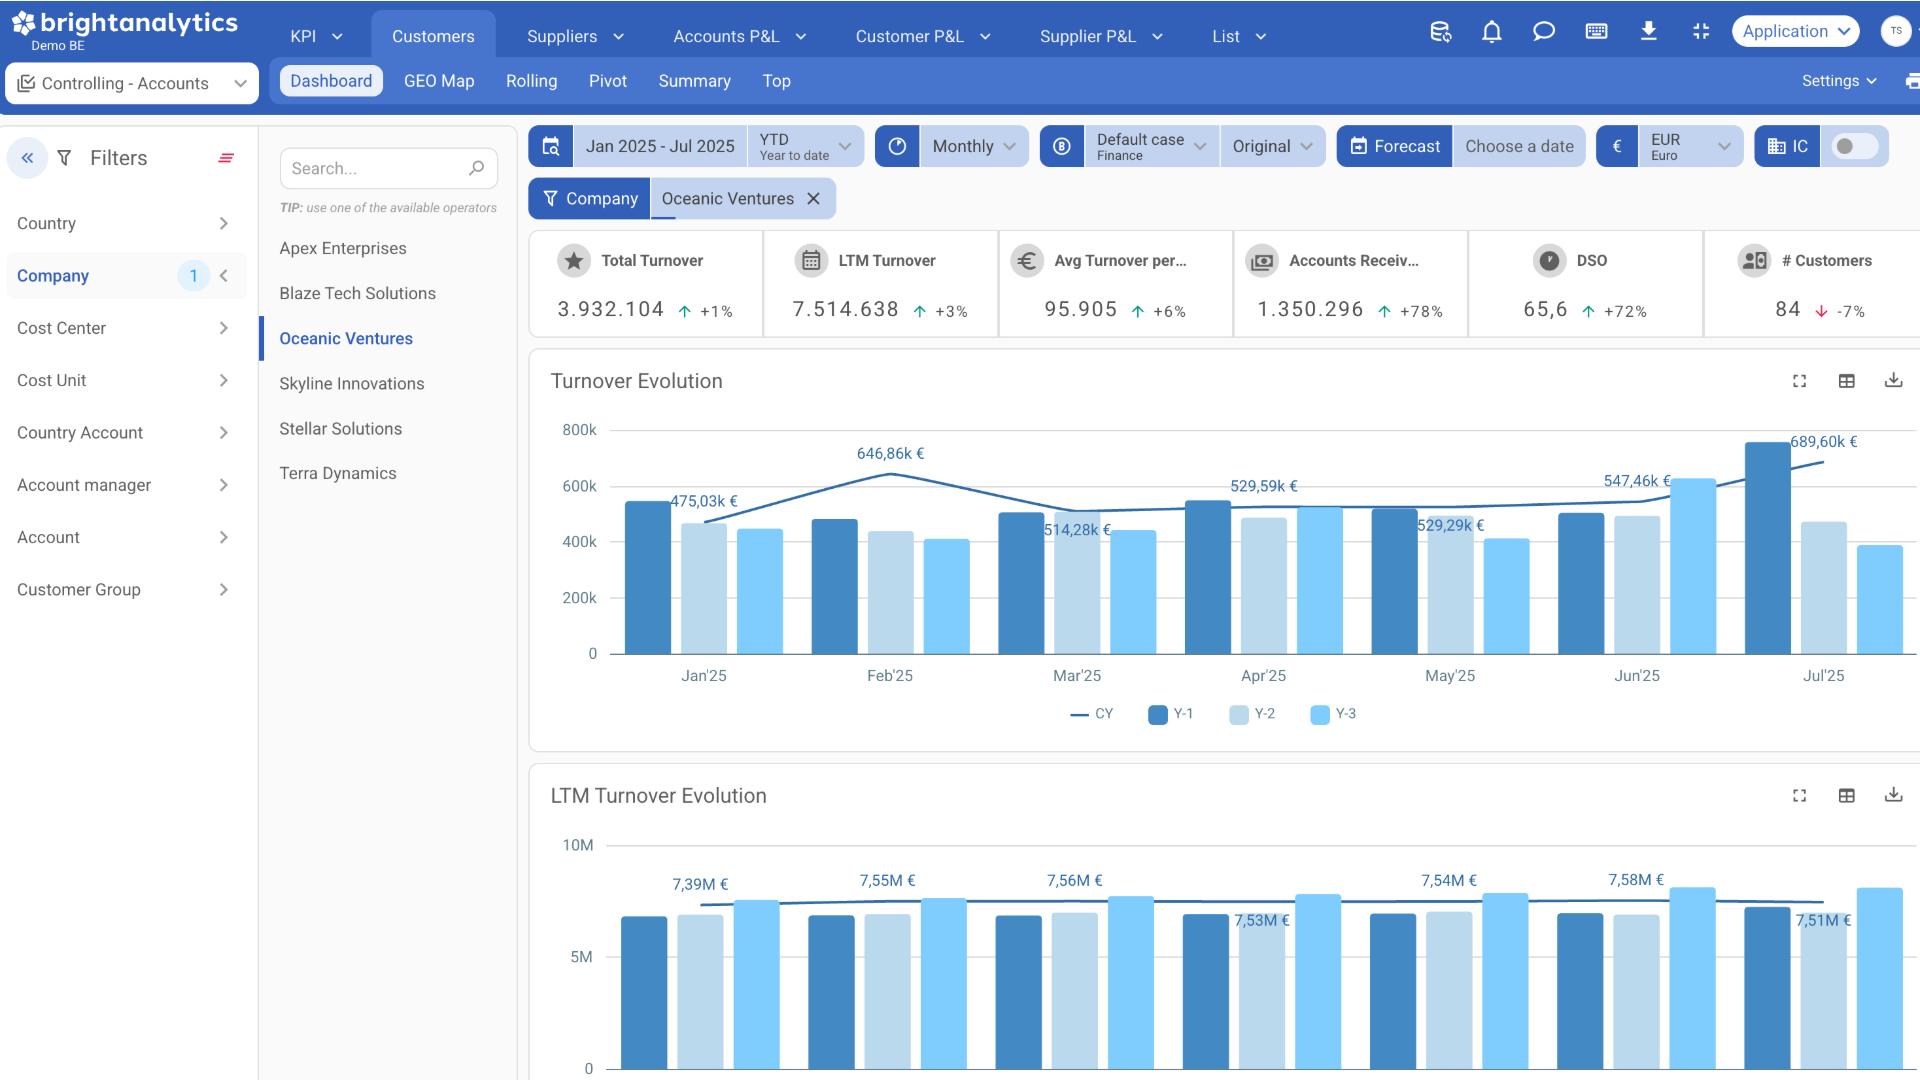
De Accounts P&L-module is de essentiële upgrade die je resultatenrekening nodig heeft. In plaats van een drill-down naar grootboekrekeningen biedt het een directe koppeling naar je klanten of leveranciers. Hierdoor zie je onmiddellijk de cijfers die er echt toe doen, waardoor winstgevendheidsanalyses sneller en betrouwbaarder zijn dan ooit tevoren. Met een lay-out die volledig gericht is op bedrijfsentiteiten, kun je snel prestaties over periodes vergelijken en betrouwbare prognoses opstellen die rechtstreeks verbonden zijn met je belangrijkste relaties, wat leidt tot scherpere strategische beslissingen.
Controlling
KPI’s
Meet je prestaties met KPI’s zoals:
- DSO
- DPO
- gemiddelde omzet
- kosten per klant/leverancier
- LTM/YTD Omzet
- …
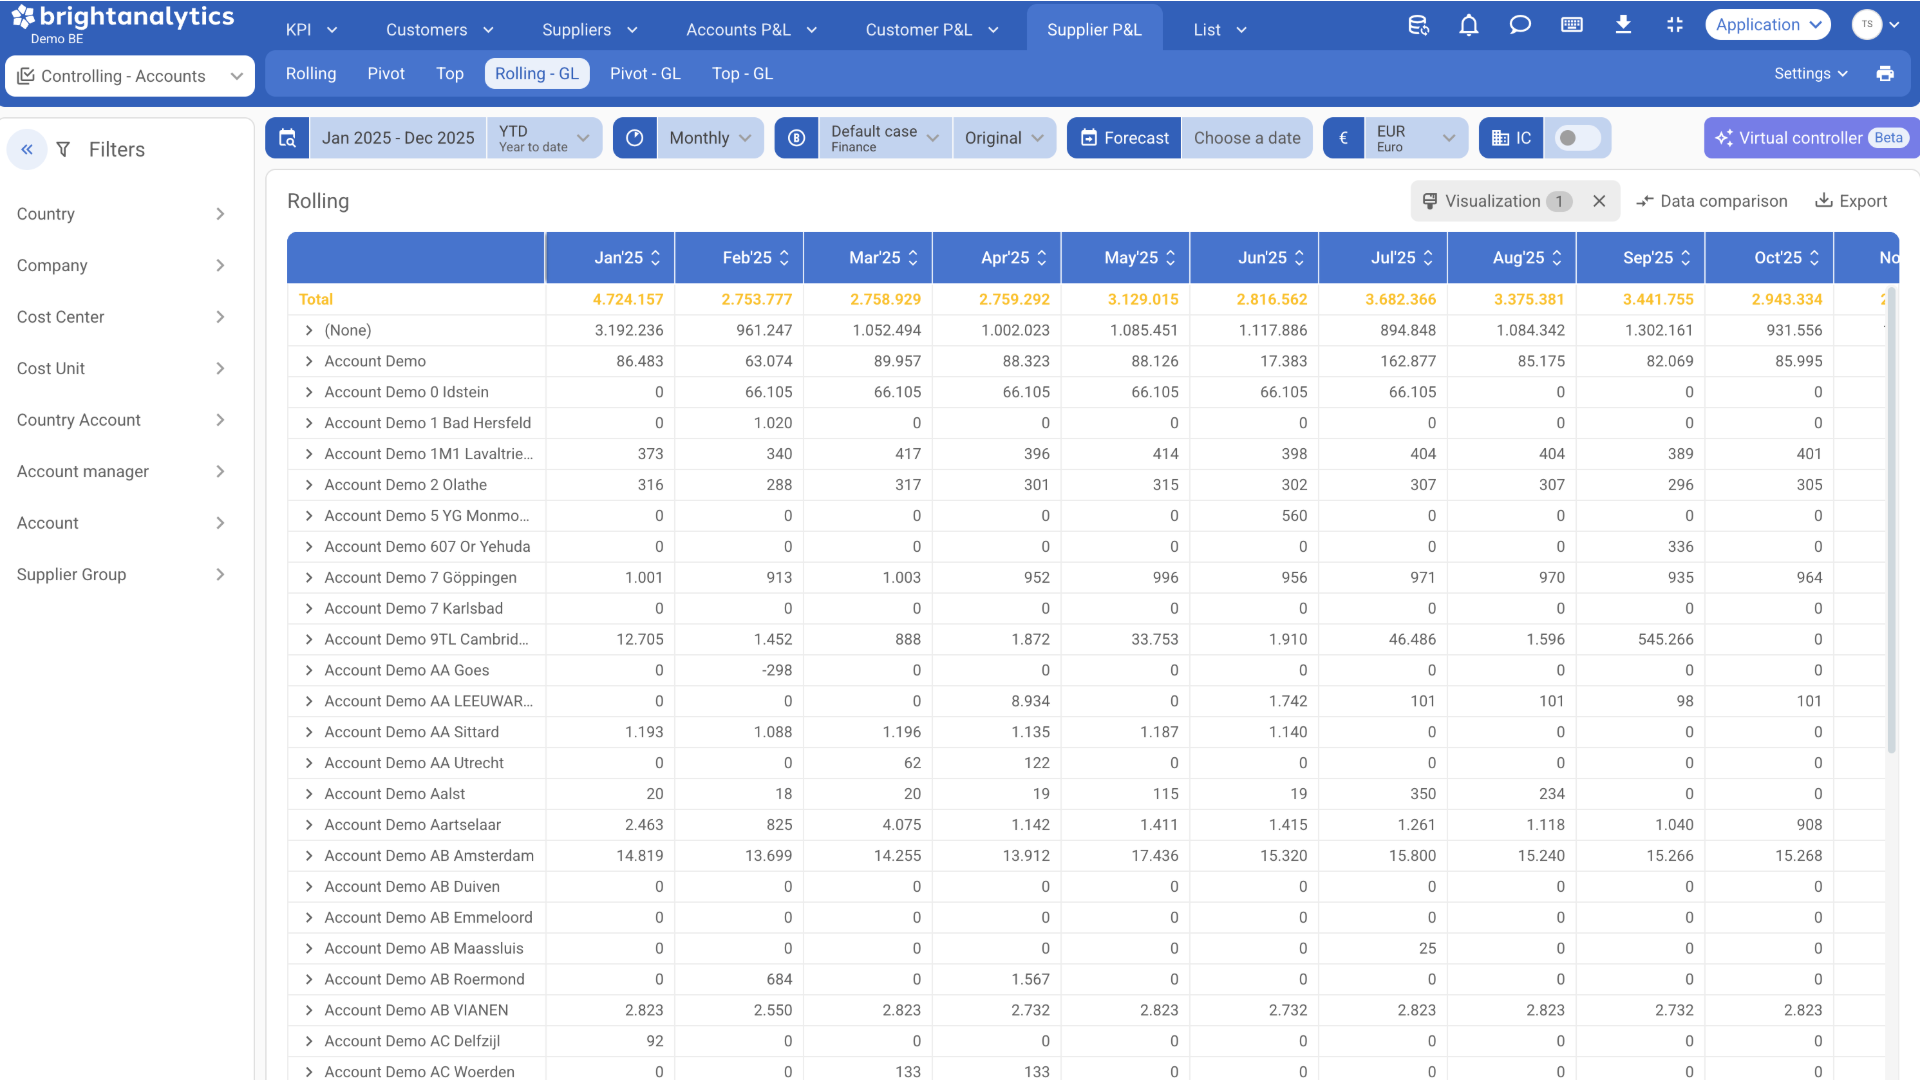
Filteropties
De app biedt flexibele filters voor bedrijf, land, kosteneenheid en meer. Het maakt ook filteren op accountniveau mogelijk om specifieke bijdragen aan cijfers te identificeren.
Heatmap
Door een eenvoudige heatmap te gebruiken, kun je de hoogtepunten en schommelingen in je financiële gegevens effectief identificeren en analyseren. Bovendien kun je met deze tool de cijfers van vorig jaar vergelijken, zodat je de evoluties in de loop van de tijd kunt raadplegen en volgen.
GEO-kaart
Wil je je omzet of kosten per locatie bijhouden? Onze GEO-kaart toont omzet en kosten per land en postcode, gebaseerd op gegevens van klanten/leveranciers.
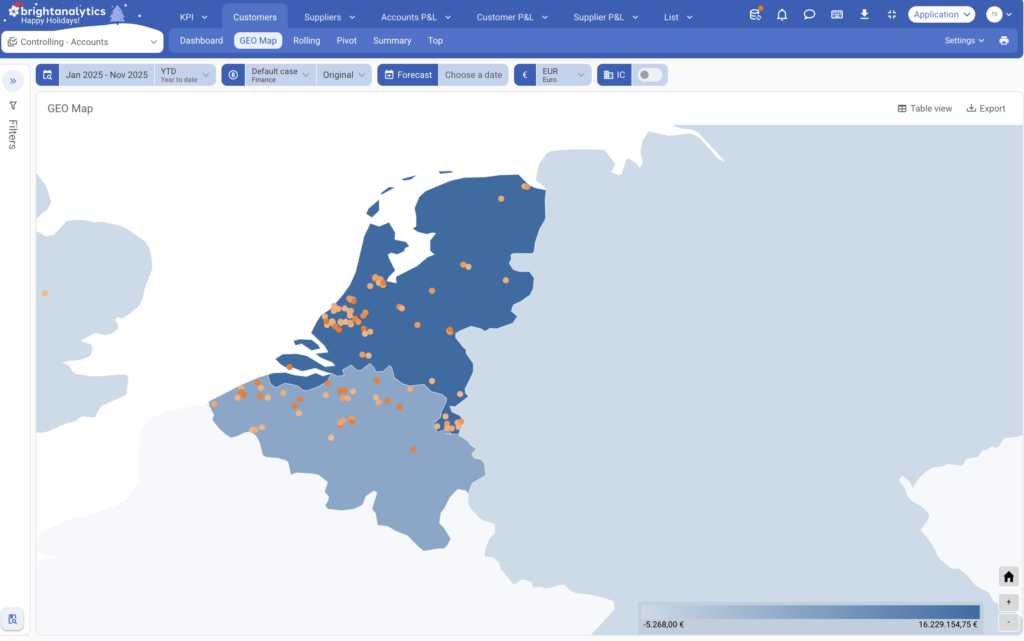
Inkomsten monitoren
Begrijp hoe je inkomsten worden gegenereerd: ontdek welke accountmanagers deze genereren, identificeer je belangrijkste klanten en gebruik de geokaart om te zien waar deze worden gegenereerd.
Budget
Beheer je budget zorgvuldig. Controleer of er nog ruimte is binnen je geplande budgetten en overweeg eventuele aanpassingen om de marges te optimaliseren.
Kosten gekoppeld aan documentnummers
Voor belangrijke kosten kun je ook specifiek traceren welke factuur, bestelbon, … eraan gekoppeld is.

Laten we je gegevens laten spreken. BrightAnalytics heeft meer dan 400 integraties.
- Verbind alle soorten toepassingen, zowel boekhouding als ERP en CRM.
- De bron kan online zijn, on-premise of zelfs een spreadsheet.
- Een willekeurig aantal toepassingen kan worden gecombineerd op het platform.
FAQ
Hieronder vind je antwoorden op veelgestelde vragen over onze controlling app. Als je een vraag hebt die hier niet wordt behandeld, kun je altijd rechtstreeks contact met ons opnemen.
- Connecteert BrightAnalytics met mijn pakket?
Op de pagina https://www.brightanalytics.eu/integraties/ vind je een lijst met al onze integraties.
- Wat is het verschil tussen Customer & Supplier agings en Controlling Accounts?
Agings tonen je openstaande facturen voor customers en suppliers, dat wil zeggen facturen die zijn verstuurd maar nog niet zijn betaald.
Controlling accounts tonen de opbrengsten en kosten die daadwerkelijk zijn gerealiseerd, dat wil zeggen betalingen die al zijn ontvangen of gedaan.
- Moet mijn pakket een Cloud pakket zijn?
Nee, je pakket hoeft geen Cloud pakket te zijn. BrightAnalytics koppelt met pakketten uit de Cloud, op de server of zelfs Excel files.
- Wat is het verschil tussen Controlling Dimensions en Controlling Accounts
Controlling (Accounts) in BrightAnalytics richt zich op grootboekrekeningen en kern-KPI’s om financiële prestaties en kostenstructuren te monitoren. Ben je vooral geïnteresseerd in een overzicht en analyse van resultaten en kosten? Dan biedt Controlling (Accounts) de juiste inzichten. Wil je financiële gegevens gedetailleerd segmenteren en analyseren over meerdere dimensies, bijvoorbeeld per afdeling, project of locatie? Dan is Controlling Dimensions het ideale hulpmiddel voor diepgaande segmentanalyses en prestatie-inzichten.
Bekijk deze app in actie
- Bekijk een video
- Vraag een demo aan
Als je je e-mail achterlaat, kun je een video bekijken over onze controlling app.
Door je gegevens achter te laten, wordt er contact met je opgenomen voor een persoonlijke demo met uitleg over de controlling app.